Example Processing & interpretation of array PLT data + Temperature
A12 is a subsea well in the Clair field (North Sea). This well is operated by BP. The studied well is broken up in segments that are separated by either blanks or packers. In some parts of the wells the fluids are produced into the annulus and then flowing into the predrilled liner. In other parts of the well, the well segments are also separated by packers, but the fluids enter the liner through one valve in each segment.
In 2008 array PL data (MAPS) was acquired in well A12. The well was logged at SI, 50% and 100 % rate. The toolstring consisted of a complete suite of centered tools: temperature, pressure, spinner, nuclear density and capacitance. The array tools suite consisted of a SAT and a RAT. Subsea wells are hard to access, therefore a quick interpretation turnaround was required. In a number of intervals the centered (Density, FCAP) and array holdups tools(RAT) showed a 100% water holdup and the centered and array spinners showed negative velocity. Above these intervals, the holdup tools show the presence of hydrocarbons and the spinners show a positive velocity.
This indicates that the logging tools are only able to detect local effects, such as water recirculation. In other intervals no recirculation is observed in any x-sectional layer. The only explanation is that the toolstring is measuring in a different layer from one interval to another and because the tools are only measuring within the predrilled liner; it means that the liner moves from one layer to another.
Fluids can be produced from the entire interval, but in the recirculation intervals, the inflow of fluids is not seen by any of the tools, except for the temperature. We have successfully analyzed the dataset with Plato within the imposed short timeframe. All acquired data was used during the analysis except for in the recirculation intervals. In the recirculation intervals, only the temperature was used quantitatively to obtain production rates.
The analysis of A12 was discussed in SPE paper: SPE-133479-MS-P."Production Logging in Highly Deviated and Horizontal Wells: Moving from Qualitative to Quantitative Answers.” SPE Annual Technical Conference and Exhibition held in Florence, Italy, 19-22 September 2010.
-
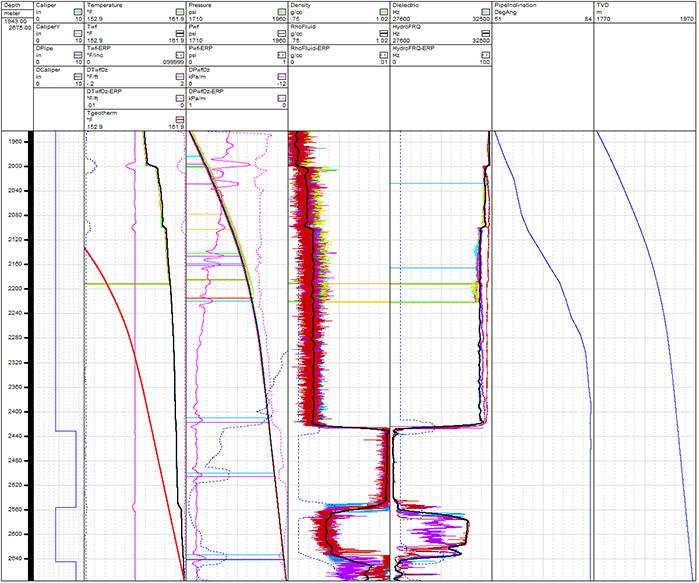
 Input Log data with tracks showing measured curves at well site
 -
 Results from the Preprocessing
 -
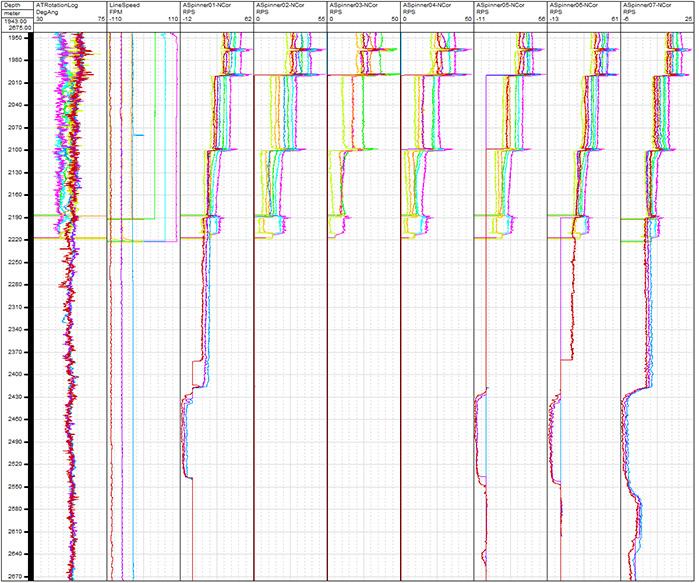 SAT Input data containing curves from each of the 6 Array Spinners
 -
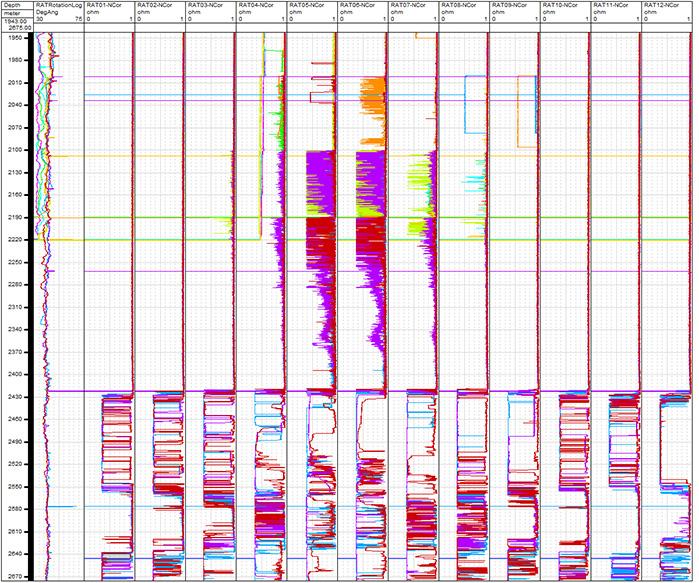 RAT Input data containing curves from each of the 12 RAT probes
 -
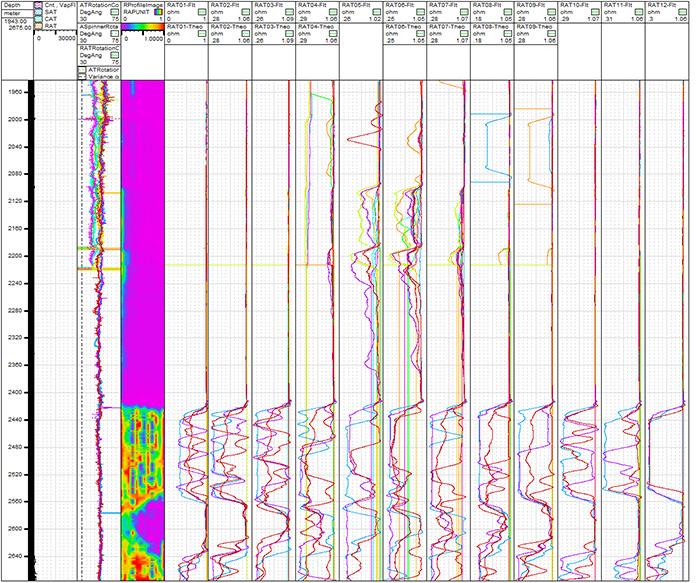 Calibration of the RAT data
 -
 Calibration of the Spinner data
 -
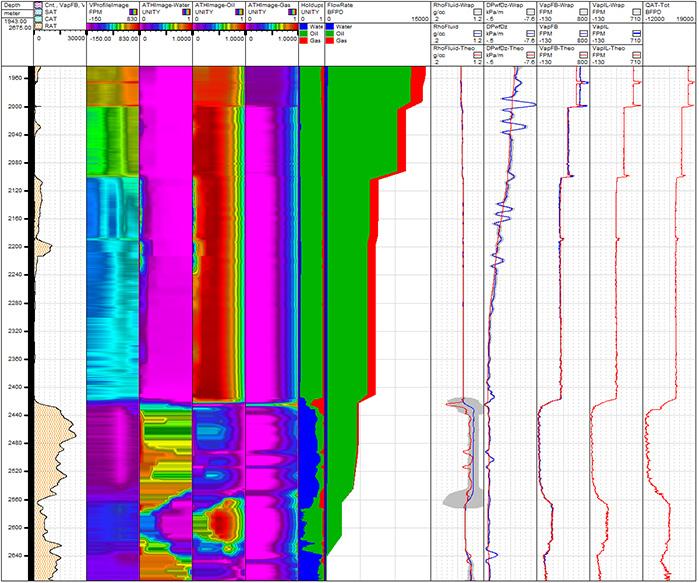 Layered Holdups and Velocity Profile
 -
 Verification of Flow Model and surface rates